Archive

May 2025

Browsing

With Elon Musk leaving his role at the White House as head of the Department of Government Efficiency and President Donald Trump saying DOGE’s work will continue, the question now in Washington is who will take the reins to become Musk’s successor.

Musk, who has led Trump’s waste-cutting task force from Inauguration Day until now, announced his departure in an X post this week, saying: ‘As my scheduled time as a Special Government Employee comes to an end, I would like to thank President @realDonaldTrump for the opportunity to reduce wasteful spending,’

Musk said the DOGE mission ‘will only strengthen over time as it becomes a way of life throughout the government.’

So, who will take Musk’s place? Right now, no one.

A senior White House official previously told Fox News Digital that ‘the DOGE employees at their respective agency or department will be reporting to and executing the agenda of the president through the leadership of each agency or department head.’

The official said DOGE is now part of the ‘DNA’ of the federal government, and that it will keep operating as it already has. 

Speaking with reporters on Thursday, White House Press Secretary Karoline Leavitt confirmed that ‘the DOGE leaders are each and every member of the president’s cabinet and the president himself, who is wholeheartedly committed to cutting waste, fraud and abuse from our government.’

These statements cast doubt on whether any singular individual will succeed Musk as the DOGE chief. However, if Trump finds a DOGE successor necessary and decides to shift gears, who could fill Musk’s shoes?  

Amy Gleason

While Musk was never an official federal employee, Amy Gleason, a little-known government employee who also worked in the first Trump administration, has been serving as the official acting chief of the United States DOGE Service (USDS) since February.

If the president decides to steer clear of any public-facing DOGE chief, it seems likely that he will keep Gleason on as a more behind-the-scenes DOGE leader at USDS.

Gleason, 53, is a career official who was recognized by the Obama administration as a ‘champion of change’ for her work with several nonprofits researching and raising awareness about a rare autoimmune disorder known as Juvenile Myositis. Gleason previously worked in the first Trump administration in what was then called the U.S. Digital Service before leaving to work at Russell Street Ventures, which was founded by Brad Smith, another DOGE leader.

Keeping Gleason on as DOGE chief would allow the president to keep the agency’s efforts alive while following the structure of each cabinet head leading their own waste-cutting programs.

Russell Vought

As director of the White House Office of Management and Budget, Russell Vought has already been a central figure in DOGE’s waste-cutting efforts.

The Wall Street Journal reported that Vought already has plans to continue Musk’s efforts, even in his current role as OMB head. Vought is a close ally of Trump and a much more subdued personality than Musk, making him appear as a likely pick to take over DOGE. 

However, Vought does come with his own political baggage, with many on the left labeling him a ‘Christian nationalist’ and criticizing his role as a co-author of Project 2025. Still, he was successfully confirmed by the Senate in his current role as OMB director.

Vivek Ramaswamy

A one-time GOP presidential candidate-turned key Trump ally, Vivek Ramaswamy, has been widely reported as a top contender to replace Musk at the helm of DOGE. Ramaswamy co-led DOGE alongside Musk for a short period at the start of Trump’s second term. However, he stepped down from his DOGE leadership role in February to begin his run for Ohio governor.

Though Ramaswamy shares Musk’s and Trump’s vision for cutting government waste, it would seem unlikely he would rejoin the DOGE team any time soon with his eyes on winning the keys to the Ohio governor’s mansion in 2026.

Fox News Digital’s Diana Stancy contributed to this report.

This post appeared first on FOX NEWS

A federal appeals court paused a lower ruling blocking President Donald Trump’s sweeping tariffs, siding with the administration Thursday in a legal fight over the White House’s use of an emergency law to enact punishing import taxes. 

The back-and-forth injected more volatility into markets this week after several weeks of relative calm, and court observers and economists told Fox News Digital they do not expect the dust to settle any time soon. 

Here’s what to know as this litigation continues to play out.

What’s happening now?

The U.S. Court of Appeals for the Federal Circuit temporarily stayed a lower court ruling Thursday that blocked two of Trump’s sweeping tariffs from taking force.

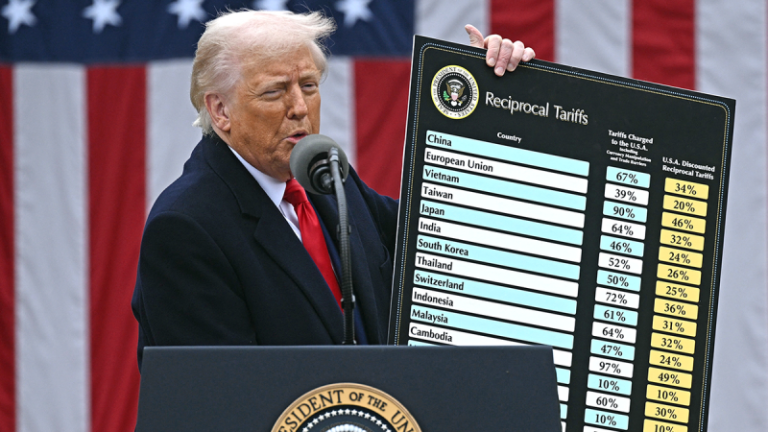
The ruling paused a decision by the U.S. Court of International Trade (CIT) allowing Trump to continue to enact the 10% baseline tariff and the so-called ‘reciprocal tariffs’ that he announced April 2 under the International Emergency Economic Powers Act, or IEEPA.

It came one day after the U.S. Court of International Trade ruled unanimously to block the tariffs.

Members of the three-judge panel who were appointed by Trump, former President Barack Obama and former President Ronald Reagan, ruled unanimously that Trump had overstepped his authority under IEEPA. They noted that, as commander in chief, Trump does not have ‘unbounded authority’ to impose tariffs under the emergency law. 

Now, lawyers for the Trump administration and the plaintiffs are tasked with complying with a fast schedule with deadlines in both courts. Plaintiffs have until 5 p.m. Monday to file their response to the Court of International Trade, according to Jeffrey Schwab, senior counsel and director of litigation of the Liberty Justice Center, which represents five small businesses that sued the administration. 

The Court of Appeals for the Federal Circuit gave plaintiffs until Thursday to file a response to the stay and the Trump administration until June 9 to file a reply, Schwab told Fox News Digital in an interview. 

The goal is to move expeditiously, and lawyers for the plaintiffs told Fox News they plan to file briefs to both courts before the deadlines to mitigate harm to their clients.

‘Hopefully,’ Schwab said, the quick action will allow the courts to issue rulings ‘more quickly than they otherwise would.’

What’s at stake?

The Trump administration praised the stay as a victory.

The appellate court stay on the CIT ruling ‘is a positive development for America’s industries and workers,’ White House spokesman Kush Desai said in a statement.

‘The Trump administration remains committed to addressing our country’s national emergencies of drug trafficking and historic trade deficits with every legal authority conferred to the president in the Constitution and by Congress.’

But some economists warned that continuing to pursue the steep tariffs could backfire. 

The bottom line for the Trump administration ‘is that they need to get back to a place [where] they are using these huge reciprocal tariffs and all of that as a negotiating tactic,’ William Cline, an economist and senior fellow emeritus at the Peterson Institute for International Economics, said in an interview. 

Cline noted that this had been the framework laid out earlier by Treasury Secretary Scott Bessent, who had embraced the tariffs as more of an opening salvo for future trade talks, including between the U.S. and China. 

‘I think the thing to keep in mind there is that Trump and Vance have this view that tariffs are beautiful because they will restore America’s Rust Belt jobs and that they’ll collect money while they’re doing it, which will contribute to fiscal growth,’ said Cline, the former deputy managing director and chief economist of the Institute of International Finance.

‘Those are both fantasies.’

What happens now?

Plaintiffs and the Trump administration wait. But whether that wait is a good or bad thing depends on who is asked.

Economists noted that the longer the court process takes, the more uncertainty is injected into markets. This could slow economic growth and hurt consumers. 

For the U.S. small business owners that have sued Trump over the tariffs, it could risk potentially irreparable harm.

‘Some of the harm has already taken place. And the longer it goes on, the worse it is,’ said Schwab. 

The White House said it will take its tariff fight to the Supreme Court if necessary. But it’s unclear if the high court would choose to take up the case.

The challenge comes at a time when Trump’s relationship with the judiciary has come under increasing strain, which could make the high court wary to take on such a politically charged case. 

Lawyers for the plaintiffs described the case as ‘very likely’ to be appealed to the Supreme Court, but it’s unclear whether it will move to review it.

‘It’s possible that because the case is before the Federal Circuit Court of Appeals, which essentially applies to the country, unlike specific appellate courts, which have certain districts, that the Supreme Court might be OK with whatever the Federal Circuit decides and then not take the case,’ Schwab said. 

For now, the burden of proof shifts to the government, which must convince the court it will suffer ‘irreparable harm’ if the injunction remains in place, a high legal standard the Trump administration must meet.

Beyond that, Schwab said, the court will weigh a balancing test. If both sides claim irreparable harm, the justices will ask, ‘Who is irreparably harmed more?

‘And I think it’s fair to say that our clients are going to be more irreparably harmed than the United States federal government. Because our clients might not exist, and the United States federal government is certainly going to exist.’

This post appeared first on FOX NEWS

Hunter Biden was seen out and about with his family in Cape Town, South Africa, Friday amid Republicans’ investigation into an alleged ‘conspiracy’ related to his father’s cognitive decline as president. 

The embattled son of the former president toured Cape Town with his wife, Melissa Cohen Biden, and son, Beau Biden Jr., driving a rented Toyota sedan, a big change from the black Chevy Suburbans he was used to traveling in before President Donald Trump yanked his Secret Service detail. 

In March, Trump terminated Hunter Biden’s Secret Service detail after former President Joe Biden extended his son’s detail indefinitely. Typically, children of former presidents only enjoy Secret Service protection if they are 16 or younger.

Trump’s move to remove Hunter Biden’s detail came as the former president’s son was once again vacationing in South Africa.

Hunter Biden and his family were seen on the Sea Point Main Road, a main thoroughfare in a wealthy part of Cape Town, paying for parking and stopping into the local butcher. Based on the images, it is apparent Hunter no longer has the luxury of a Secret Service detail.

The new pictures also mark the first time Hunter Biden has been seen publicly since his father’s public cancer announcement.

Republicans are launching a new investigation into the alleged ‘conspiracy’ behind former President Joe Biden’s cognitive decline. 

Senstors Eric Schmitt, R-Mo., and John Cornyn, R-Texas, announced plans to hold a Senate Judiciary hearing June 18 to look into the alleged cover-up of the 82-year-old former president’s mental decline while in office by the media and those closest to him.

The lawmakers are still gathering witnesses for the probe, which would be the first full congressional committee hearing on the subject.

Fox News Digital’s Alex Miller contributed to this report.

This post appeared first on FOX NEWS

Amazon’s devices unit has a new team tasked with inventing “breakthrough” consumer products that’s being led by a former Microsoft executive who helped create the Xbox.

The ZeroOne team is spread across Seattle, San Francisco and Sunnyvale, California, and is focused on both hardware and software projects, according to job postings from the past month. The name is a nod to its mission of developing emerging product ideas from conception to launch, or “zero to one.”

Amazon has a checkered history in hardware, with hits including the Kindle e-reader, Echo smart speaker and Fire streaming sticks, as well as flops like the Fire Phone, Halo fitness tracker and Glow kids teleconferencing device.

Many of the products emerged from Lab126, Amazon’s hardware research and development unit, which is based in Silicon Valley.

The new group is being led by J Allard, who spent 19 years at Microsoft, most recently as technology chief of consumer products, a role he left in 2010, according to his LinkedIn profile. He was a key architect of the Xbox game console, as well as the Zune, a failed iPod competitor.

Allard joined Amazon in September, and the company confirmed at the time that he would be part of the devices and services team under Panos Panay, who left Microsoft for Amazon in 2023 to lead the group.

An Amazon spokesperson confirmed Allard oversees ZeroOne but declined to comment further on the group’s work.

The job postings provide few specific details about what ZeroOne is building, though one listing references working on “conceiving, designing, and bringing to market computer vision techniques for a new smart-home product.”

Another post for a senior customer insights manager in San Francisco says the job entails owning “the methodology and execution of concept testing and early feedback for ZeroOne programs.”

“You’ll be part of a team that embraces design thinking, rapid experimentation, and building to learn,” the description says. “If you’re excited about working in small, nimble teams to create entirely new product categories and thrive in the ambiguity of breakthrough innovation, we want to talk to you.”

Amazon has pulled in staffers from other business units that have experience developing innovative technologies, including its Alexa voice assistant, Luna cloud gaming service and Halo sleep tracker, according to Linkedin profiles of ZeroOne employees. The head of a projection mapping startup called Lightform that Amazon acquired is helping lead the group.

While Amazon is expanding this particular corner of its devices group, the company is scaling back other areas of the sprawling devices and services division.

Earlier this month, Amazon laid off about 100 of the group’s employees. The job cuts included staffers working on Alexa and Amazon Kids, which develops services for children, as well as Lab126, according to public filings and people familiar with the matter who asked not to be named due to confidentiality. More than 50 employees were laid off at Amazon’s Lab126 facilities in Sunnyvale, according to Worker Adjustment and Retraining Notification (WARN) filings in California.

Amazon said the job cuts affected a fraction of a percent of the devices and services organization, which has tens of thousands of employees.

This post appeared first on NBC NEWS

While U.S. President Donald Trump’s tariffs play out in U.S. courts, another one of his proposed laws could weaponize the American tax system.

Investment banks and law firms warn this step could prove to be as significant as the impact of duties on investors.

The “One Big Beautiful Bill Act,” which passed through the U.S. House of Representatives last week, includes the most sweeping changes to the tax treatment of foreign capital in the U.S. in decades under a provision known as Section 899. The bill must still gain the Senate’s approval.

“We see this legislation as creating the scope for the US administration to transform a trade war into a capital war if it so wishes,” said George Saravelos, global head of FX research at Deutsche Bank on Thursday.

“Section 899 challenges the open nature of US capital markets by explicitly using taxation on foreign holdings of US assets as leverage to further US economic goals,” Saravelos added in the note to clients, under the subtitle “weaponization of US capital markets in to law.”

Section 899 says it will hit entities from “discriminatory foreign countries” — those that impose levies such as the digital services taxes that disproportionately affect U.S. companies.

France, for instance, has a 3% tax on revenues from online platforms, which primarily targets big technology firms such as Google, Amazon, Facebook, and Apple. Germany is reportedly considering a similar tax of 10%.

Under the new tax bill, the U.S. would hit investors from such countries by increasing taxes on U.S. income by 5 percentage points each year, potentially taking the rate up to 20%.

Emmanuel Cau, head of European Equity Strategy at Barclays, suggested that the mere passage of the tax legislation could make dollar assets less valuable for foreign investors.

“In our view, this is a risk for those companies generating US revenues, and domiciled in countries that have enacted Digital Services Taxes (DST) or are implementing the OECD’s Under Taxed Payment Rule (UTPR),” Cau said in a Friday note to clients.

He highlighted companies such as London-listed Compass Group, which provides catering services to U.S. schools, and InterContinental Hotels, which owns at least 25 luxury hotels in the U.S., are likely to be affected by the proposed law.

“Given US net international investment position is sharply negative, there is indeed scope for capital outflows if indeed S899 passes through the Senate in its current form,” he added.

The impact of the bill won’t be limited to European companies or individuals from those states.

The bill “could significantly increase tax rates applicable to certain non-U.S. individuals and business, governmental, and other entities,” said Max Levine, head of U.S. tax at the law firm Linklaters.

This means it could also ensnare governments and central banks, which are large investors of U.S. Treasuries. France and Germany, for instance, held a combined $475 billion worth of U.S. government bonds as of March.

The proposed tax would lower returns on U.S. Treasuries for those investors as “the de facto yield on US Treasuries would drop by nearly 100bps,” Deutsche Bank’s Saravelos added. “The adverse impact on demand for USTs and funding the US twin deficit at a time when this is most needed is clear”.

“It’s very bad,” said Beat Wittmann, chairman of Switzerland-based Porta Advisors. “This is huge — this is just one piece in the overall plan and it’s completely consistent with what this administration is all about.”

“The ultimate judge for this is not our opinions, it’s the bond market,” Wittmann added. “The U.S. bond market is discounting these developments, and we have seen in the last few weeks, that if there was a safe haven move, investors clearly prefer German bunds.”

Large Australian pension funds with U.S. investments have also been reportedly concerned by the bill, since Australia operates a medicines subsidy scheme that is opposed by large U.S. pharmaceutical companies.

Legal experts at the Mayer Brown law firm suggest that “significant changes” could be made to the bill as it passes through the U.S. Senate before it’s enshrined into law by Trump.

“As such, there may be questions about whether the provisions of the proposal that override tax treaties could be included in the US Senate’s version of the tax bill,” Mayer Brown’s experts said.

This post appeared first on NBC NEWS

SIL Silver Miners

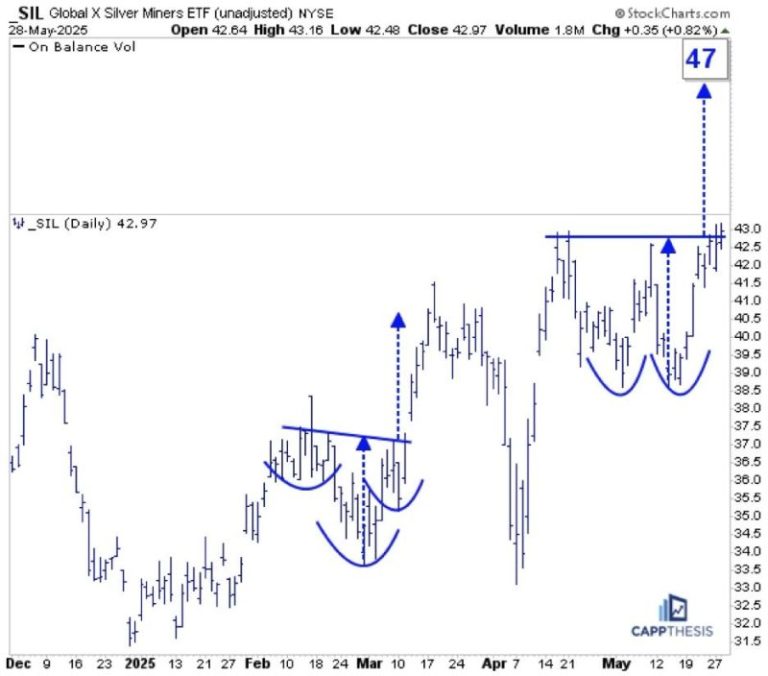
SIL was among the leaders yesterday and now is close to triggering this double-bottom bullish pattern. Staying above the 43-mark would target 47. That’s not a big move, but let’s remember that SIL is sporting bullish formations on its longer-term charts, too.

FIGURE 1. DAILY CHART OF GLOBAL X SILVER MINERS ETF (SIL).

SIL – Weekly

Firstly, the double-bottom pattern on this weekly log chart annotated in blue remains alive. This objective is up near 49.

Secondly, the area highlighted in green here is the same pattern pictured on the daily chart above. That area is sitting at the very top of a much bigger bullish inverse head-and-shoulders pattern that extends all the way back to 2021. Thus, if the short-term breakout works, it will trigger this one, as well. That target is in the mid-70s…

FIGURE 2. WEEKLY CHART OF GLOBAL X SILVER MINERS ETF (SIL).

SIL – Monthly

And that green pattern above is part of this MUCH larger, 13-year potential double bottom. We still have a while to go before this one is triggered, but it’s important to keep all of these in the back of our minds.

Anyone who trades or tracks SIL knows that short-term whipsaws are the norm. So, while these breakouts may not be clean, the bullish structures are clear. The bottom line is that if SIL continues to make higher highs and higher lows, the patterns will continue to work.

FIGURE 3. MONTHLY CHART OF GLOBAL X SILVER MINERS ETF (SIL).

USO Crude Oil

USO was among the leaders yesterday, but it’s still trying to bust through its 50-DMA, which has been the sticking point the last few weeks. If it can soon, USO could complete this potential bullish inverse H&S pattern. The upside target would be in the 77-78 range, and that would align with key short-term tops from the last year. First step, push above the 50-day line…

FIGURE 4. DAILY CHART OF US OIL FUND (USO).

NVDA

The obvious question every time NVDA rallies is whether it’s too late to buy.  To get a true sense of the stock’s technical prospects, we need to view it across different charts and time frames.

First, here’s a view of the bullish flag pattern we cited on Tuesday (along with TSLA, GOOGL and META). Given the preceding staircase-like advance, the starting point of the flagpole is subjective. We’re using the early May low given that the stock avoided filling a gap from a few days earlier.

Regardless, the measured move counts to the 161 zone, which would be a new all-time high.

FIGURE 5. DAILY CHART OF NVIDIA CORP. (NVDA).

This second one is a daily chart that extends all the way back to 2010 and shows times when breaking below or above the 200-DMA led to strong, extended moves for the stock. From this angle, the recent 200-day breach didn’t last that long at all, and now NVDA has the chance to once again follow through after breaking back above it over the last few weeks.

FIGURE 6. LONGER-TERM DAILY CHART OF NVIDIA CORP. (NVDA).

Here’s a weekly, log chart going back to the 2022 low. NVDA has leveraged three major pattern breakouts since then to power the astounding rally the last two-plus years. With the stock last having made a new high last October and being net flat since last July, an eventual push back above the 150-zone could prompt big pattern-breakout number four.

FIGURE 7. WEEKLY CHART OF NVIDIA CORP. (NVDA).

Lastly, here are the biggest breakouts on this monthly chart that goes back over two decades. Again, looking at it from this viewpoint makes the last 11 months appear like a very small digestive phase, especially compared to the other three on the chart. Thus, the first step will be seeing how well NVDA can hold the opening gap. That’s important for today, but much more important for the days and weeks to come.

FIGURE 8. MONTHLY CHART OF NVIDIA CORP. (NVDA).

Nuclear energy stocks are on a tear, and Oklo Inc. (OKLO), Cameco Corp. (CCJ), and NuScale Power Corporation (SMR) are leading the charge, fueled by presidential executive orders, investor hype, and hopes for a nuclear-powered future.

Is It Time to Go Nuclear?

These names bucked the trend on Wednesday, rising even as the major U.S. indexes fell. I found all three while running a P&F Double Top Breakout scan, with SMR also appearing in the New 52-Week Highs scan. But are these gains a sign of genuine investment opportunities, or is this high-risk subsector just radioactive for your portfolio? To analyze this, let’s break down their profiles and charts to see whether the “glow” here points to real promise—or simply masks a toxic risk.

Here’s a PerfCharts snapshot of all three stocks against the SPDR S&P 500 ETF (SPY), our broader market proxy.

FIGURE 1. PERFCHARTS OF SMR, OKLO, CCJ, AND SPY.

While CCJ steadily lagged behind the S&P 500 until this month, both OKLO and SMR began outperforming the broader market starting in mid-October of last year. Their relative performance to date is so strong that it appears almost unsustainable in the short term.

All three mid-cap stocks are also showing robust StockCharts Technical Rank (SCTR) scores—OKLO at 99.6, SMR at 99.3, and CCJ at 89.9 at the time of writing. While this can indicate technical strength, it can also signal irrational exuberance among retail investors.

Robust SCTR Scores but Divergent Fundamentals

Another thing to note is the notable difference in their fundamentals. SMR and OKLO have negative P/E ratios, suggesting that their surges are driven more by promise and speculation than by profits. CCJ, with a P/E ratio of 149, is raking in some profits, but may also be riding an overcrowded wave of hype.

Ultimately, while technical performance can sometimes lead to fundamental strength—or mask fundamental weakness—it’s worth taking a closer look at these leading names in the nuclear subsector to understand the opportunities and risks they present. Let’s break it down further by examining each stock’s technical picture and what it suggests about investor conviction.

OKLO: Testing Highs, Buying the Dip?

To start, here’s a daily chart of nuclear energy startup OKLO.

FIGURE 2. DAILY CHART OF OKLO. In contrast to the other two nuclear stocks, OKLO is potentially experiencing higher levels of accumulation.

OKLO recently tested its all-time high of $59 before pulling back. The Relative Strength Index (RSI) shows the stock was deep within overbought territory, hinting at caution. Still, what’s interesting is that OKLO’s Accumulation/Distribution Line (ADL), plotted behind the price, remains strong. This suggests that even as the price retreats, buying pressure may still be present—hinting that investors might be looking to buy the dip rather than “sell the news.”

The key thing to watch now is how deep this retracement goes. If investors are still optimistic about OKLO’s fundamental outlook, you might see a bounce within the first two quadrants marked by the Quadrant Lines on the chart. Pay particular attention to the critical support range around the center line at $38, shown in the yellow-shaded area. If the price falls below this level, it could be a sign of weakness, suggesting the stock is more of a FOMO-driven trade than one backed by long-term conviction.

SMR: Hype or Healthy Pullback?

Next, we’ll shift over to a daily chart of SMR. Among the three, SMR is the only to notch a new all-time high. But does this signal the beginning of a new leg up, or the end of a surge that lacks substance?

FIGURE 3. DAILY CHART OF SMR. What happens next will show whether investors truly believe in the stock—or if the rally was driven by short-term hype.

SMR immediately declined after making a parabolic move to a new all-time high. As the RSI confirms, the stock was well-overbought. Now, it’s a matter of measuring the depth of the pullback.

I plotted a Fibonacci Retracement to highlight potential support levels. There are several zones of support from previous swing highs and a concentrated trading area between the 61.8% and 38.2% retracement levels. If investor confidence stays strong, expect a possible bounce between $21 and $24, marking the 61.8% and 50% Fib levels respectively. A deeper drop below the 61.8% level might still find support around $15, but that would also suggest that the rally was driven more by sentiment than strategic conviction.

CCJ: Underperforming Stock, Profitable Company

Lastly, let’s take a look at the most earnings-positive company among the three. Here’s a daily chart of CCJ.

FIGURE 4. DAILY CHART OF CCJ. The critical level to watch is the range between $50 – $52.

CCJ has a similar technical profile to OKLO and SMR—it’s overbought, and it tested its all-time high on a parabolic surge, leading to a pullback.

However, instead of measuring the various degrees of its potential retracements (using Fib or Quadrants), I’m focusing on the key range of $50–$52. Why? Because, in addition to marking a broad level that has acted as both support and resistance since October of last year, this range also shows a high concentration of trading activity, as indicated by the Volume-by-Price indicator.

If longer-term conviction holds, CCJ should bounce at this level. If not, expect the stock to decline further—although it may eventually find support at lower levels, it likely wouldn’t be worth chasing at that point.

At the Close

Nuclear energy stocks like OKLO, SMR, and CCJ have captured market attention, defying broader trends and flashing bullish technical patterns. But while momentum and investor enthusiasm are driving these moves, each stock also faces questions about sustainability and fundamentals.

Are we looking at a healthy dip—or is Wall Street just selling the news? To answer that question, keep an eye on the key technical levels outlined above. With these standout names in an emerging (and therefore highly uncertain) subsector, the technicals will likely reveal whether the market’s leaning toward conviction or just chasing the hype.


Disclaimer: This blog is for educational purposes only and should not be construed as financial advice. The ideas and strategies should never be used without first assessing your personal and financial situation, or without consulting a financial professional.

In 2025, the vanadium market is navigating a complex landscape shaped by its traditional role in steelmaking and its emerging importance in energy storage technologies.

Approximately 90 percent of vanadium consumption continues to be driven by the steel industry, where it is used to strengthen alloys. However, the growing adoption of vanadium redox flow batteries (VRFBs) for grid-scale energy storage is creating new avenues for demand, particularly as countries pursue decarbonization goals and renewable energy integration.

On the supply side, vanadium sees relatively limited primary production from ore and instead relies on co-production from steel slag and uranium mining, with a portion also coming from recycling. Global production has remained relatively consistent in the 2020s at around 100,000 metric tons per year.

Four countries contribute to the vast majority of that output. Below is a brief overview of these top vanadium-producing countries based on data from the US Geological Survey’s 2025 Mineral Commodity Summary.

1. China

Mine production: 70,000 metric tons

China remains the world’s top vanadium-producing country by far, with output of 70,000 metric tons in 2024. Production has remained steady out of China in 2023 and 2024. The Asian nation far outpaces all other countries in terms of vanadium output, and leads the world in vanadium consumption as well due to its high steel production. The majority of its vanadium is produced from steel slag.

In terms of vanadium exports, China’s are ‘quite small,’ according to Fastmarkets, as producers can turn a bigger profit in the domestic market.

2. Russia

Vanadium production: 21,000 metric tons

Second on the list is Russia, whose vanadium output totaled 21,000 metric tons in 2024, essentially on par with production in the previous two years. Russia’s vanadium reserves are the second largest in the world at 5,000 MT.

EVRAZ KGOK, part of EVRAZ, is a major mining company in Russia that produces vanadium. Little other information is available about vanadium mining in Russia, and the majority of the country’s vanadium production is a co-product of steel slag.

3. South Africa

Vanadium production: 8,000 metric tons

South Africa’s vanadium output declined last year, slipping to 8,000 metric tons in 2024, The country’s vanadium output had previously held above the 8,500 MT per year a level since 2019.

South Africa’s contributions to the vanadium market consist of primary production from Bushveld Minerals (LSE:BMN) and Glencore (LSE:GLEN,OTC Pink:GLCNF). Bushveld Minerals’ vanadium division includes the Vametco mine and processing facility, the Vanchem processing facility, and the future Mokopane vanadium mine and the Belco production plant. Glencore’s Rhovan open-cast mine and smelter complex mainly produces ferrovanadium and vanadium pentoxide.

4. Brazil

Vanadium production: 5,000 metric tons

Brazil’s vanadium output has also contracted year-over-year, totaling 5,000 metric tons in 2024 compared to 5,420 MT in 2023.

Brazil’s vanadium production is largely thanks to Largo Resources (TSX:LGO,NASDAQ:LGO), which describes itself as the only pure-play vanadium producer. The company’s Maracás Menchen vanadium asset is one of the highest-grade vanadium mines in the world.

FAQs for vanadium

Who is the largest exporter of vanadium?

Brazil is the world’s largest exporter of vanadium, with Russia in second place and China and South Africa nearly tied. Brazil alone is responsible for over one-quarter of the metal’s global export market, and the four combined represented 84 percent of the market in 2023.

Which country has the most vanadium reserves?

Australia has the highest vanadium reserves in the world, coming in at 8.5 million MT as of 2024, although it should be noted that only 3 million MT are JORC compliant. Russia is in second place with 5 million MT of vanadium reserves, while China is next in line with vanadium reserves of 4.1 million.

What is vanadium used for?

Vanadium is essential in various alloys, with the most common being ferrovanadium, an alloy of iron and vanadium metal that is used in steel production. Beyond these traditional applications, the silvery-gray metal’s uses in the battery industry are growing — it’s increasingly being used in vanadium redox batteries for large-scale stationary energy storage.

Securities Disclosure: I, Georgia Williams, hold no direct investment interest in any company mentioned in this article.

Securities Disclosure: I, Melissa Pistilli, hold no direct investment interest in any company mentioned in this article.

This post appeared first on investingnews.com