Archive

July 2025

Browsing

President Donald Trump’s clawback of billions in funding for foreign aid and public broadcasting narrowly passed through its first hurdle in the Senate, but it still faces a rocky road ahead with dissent among the Senate GOP ranks.

Senate GOP leaders hoped that an agreement to carve out $400 million in global HIV and AIDS prevention funding will get some of the holdouts on board. However, doing so shrank the expected cuts from $9.4 billion to $9 billion.

But a trio of Senate Republicans joined with all Senate Democrats to vote against advancing the bill from the Senate Appropriations Committee, which required Vice President JD Vance to cast the deciding vote. 

Trump’s rescissions package would yank bank congressionally approved funding for foreign aid programs and public broadcasting. But some Senate Republicans have sounded the alarm and want changes made to the bill before it reaches the finish line.

The bill that advanced out of committee Tuesday includes just shy of $8 billion in cuts from the U.S. Agency for International Development (USAID), and over $1 billion from the Corporation for Public Broadcasting (CPB), the government-backed funding arm for NPR and PBS.

Republicans’ successful test vote comes after huddling with Office of Management and Budget Director Russ Vought, who worked to shore up support and apply pressure from the White House to get the ball rolling on the bill.

‘We’re fine with adjustments,’ Vought said. ‘This is still a great package, $9 billion, [it’s] substantially the same package, and the Senate has to work its will.’

While concerns were still raised about other aspects of the spending cuts package during the closed-door meeting, Senate Majority Leader John Thune, R-S.D., believed that carving out the cuts to Bush-era President’s Emergency Plan for AIDS Relief (PEPFAR) helped ease concerns among lawmakers.

But the changes didn’t sway all Senate Republicans. Sen. Lisa Murkowski, R-Alaska, bluntly said ‘no’ when asked if the PEPFAR carveout helped gain her support and argued, ‘I’d like to do some legislating.’ 

‘What a crazy thing, what a crazy thing,’ she said. ‘What have we been doing around here? We did a reconciliation bill. We’re doing a rescissions bill. We’re doing nominations. Nominations are important, but let’s, like, legislate.’

And Sen. Susan Collins, R-Maine, said she liked the changes but ultimately decided to vote against advancing the bill through its first hurdle.

Sen. Mitch McConnell, R-Ky., also joined in to vote against the bill. Fox News Digital reached out to his office for a statement on his decision to vote against the package. 

It now moves to yet another procedural vote, which, if successful, will open up 10 hours of total debate time on the bill and eventually set the stage for a vote-a-rama, where lawmakers on either side of the aisle can offer an unlimited number of amendments to the package.

But, House Speaker Mike Johnson, R-La., made clear that he would prefer the Senate not make any changes to the bill.

However, that request already fell on deaf ears — as it did during the budget reconciliation process that unfolded in the upper chamber last month.

Those demands already have fiscal hawks in the House grumbling, but like the budget reconciliation process before it, an amended rescissions package will likely glide through the House GOP and onto Trump’s desk. 

This post appeared first on FOX NEWS

When senior State Department officials set out to trim the agency in the ‘biggest reorganization since the Cold War,’ they couldn’t get a total headcount on employees — for months, they say.

‘It took us three months to get a list of the people that actually work in the building,’ one senior State Department official told reporters during a briefing at Foggy Bottom on Monday, defending the job cuts that detractors have claimed will damage U.S. diplomacy. 

‘They couldn’t tell you how many people worked here,’ the official said. ‘It’s sort of scary as a taxpayer and as a public servant to think that we don’t even know how many employees we have. This is a national security agency, you know. Who are these people?’

The reorganization will result in a department with about 3,000 fewer employees. Around half of those took a voluntary buyout, and the other half were given reduction in force (RIF) notices.


A handful of Secretary of State Marco Rubio’s closest advisors evaluated over 700 domestic offices within the State Department, submitting RIF (reduction in force) notices to employees in those they found to be ‘duplicative’ or ‘inefficient.’ 

The idea, officials said, was to put a ‘maximum of 12 clearances on any piece of paper,’ meaning documents would go through 12 layers of approval instead ’40, 50 clearances.’

The department had dozens of different offices handling human resources, and when a new employee was hired, they were accepting faxed records on their past work with other agencies. 

‘It’s crazy that a department that’s tasked with so many critical diplomatic, national security functions, with a $50 billion plus budget is running its affairs that way,’ an official said. 

The investigation found three separate offices dealing with sanctions, two handling arms control issues. 

‘Some of these regional offices within this sort of functional civil liberties, civil society, bureaus of democracy, human rights and labor, population, refugees and migration each had their own regional offices in addition to the country desk, regional bureau, construct,’ the official said. ‘Every independent bureau and office had its own executive director, its own HR department, its own payments.We were making payments out of like 60 plus different offices.’

Rubio’s team maintains the reductions focus on nonessential bureaucratic layers while preserving frontline diplomacy. A Supreme Court decision in late June reopened the door for mass federal layoffs after a lower court had blocked the cuts. Legal challenges from unions remain pending, though the reorganization is moving forward. 

The officials shuttered a ‘diplomats in residence’ program, which they determined to be a ‘cushy job.’ 

‘State Department employees are getting paid to go hang out at Georgetown, and sort of recruit for the Foreign Service,’ one official said, ‘without any sort of metrics or accountability.’

They didn’t touch the country desks, those specifically focused on nations like Iran or China, and didn’t fire anyone from passport services or diplomatic security. They did not make cuts at embassies or foreign posts. 

‘We touched the people that are doing these sort of like wasteful, sort of mindboggling functions or places where we found natural efficiencies in combining two offices.’

Critics have warned that cuts to the diplomatic corps could damage U.S. presence globally and cede soft power to China. 

‘A climate change office is not countering China,’ an official shot back. 

The department also shuttered an office that had been tasked with resettling Afghan refugees seeking to flee Talliban rule and culled the Bureau of Population, Refugees & Migration.

‘That office was not doing work that was countering China or serving the national interest,’ the official said. ‘China has overtaken the United States in a number of those countries. So I would argue growth at the State Department has not coincided with a growth of outcomes for the American taxpayer.’ 

In another example, an official told of a Gulf state foreign minister who complained that the Bureau of Democracy, Human Rights and Labor under the Biden administration kept pushing them to unionize foreign workers. 

‘This created huge diplomatic tension with them,’ the official said. ‘That foreign minister was delighted and wants to work with us on shared prosperity and trade agreements that aren’t trying to to be patronizing to other countries about their domestic affairs.’

Still, the process has sparked palpable tension within the department. Employees gathered tearfully in the Foggy Bottom lobby to say goodbye, some displaying signs reading, ‘Diplomacy matters.’ 

Signs with messages like ‘resist fascism’ and ‘you made an impact’ were taped up throughout the department. 

A group of more than 130 former senior officials, including former National Security Advisor Susan Rice, signed an open letter expressing concern that deep staff reductions could endanger U.S. foreign policy effectiveness.

Some have seized on the results of a whittled-down State Department and foreign aid apparatus: A report by The Atlantic found the Trump administration had given an order to incinerate 500 tons of emergency food that had been purchased during the Biden administration as aid to be distributed in Afghanistan and Pakistan. 

‘It’s a little bit of a shame to see people behaving that way. You sort of wonder whether they had any interest in following the president and sort of, upholding their oath to listen to the commands of the people,’ one official said.

This post appeared first on FOX NEWS

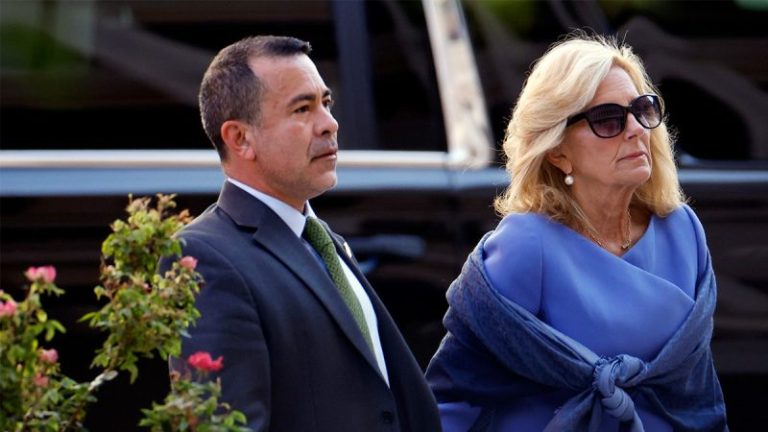
A former top White House advisor to ex-first lady Jill Biden was subpoenaed to appear before the House Oversight Committee on Wednesday.

Anthony Bernal, former assistant to the president and senior advisor to the first lady, was compelled for a July 16 closed-door deposition after missing a previously agreed-upon interview date late last month.

House Oversight Committee Chair James Comer’s subpoena letter to Bernal read: ‘The Committee seeks information about your assessment of and relationship with former President Biden to explore whether the time has come for Congress to revisit potential legislation to address the oversight of presidents’ fitness to serve pursuant to its authority under Section 4 of the Twenty-Fifth Amendment or to propose changes to the Twenty-Fifth Amendment itself.’

While the deposition is moving forward Wednesday morning, it’s not guaranteed Bernal will show up until he’s seen in the corridors of the House office building where the meeting is taking place.

Comer, R-Ky., is investigating allegations that Biden’s former top White House aides covered up signs of his mental and physical decline while in office, and whether any executive actions were commissioned via autopen without the president’s full knowledge. Biden allies have pushed back against those claims.

‘Original Sin,’ a book by CNN anchor Jake Tapper and Axios political correspondent Alex Thompson, positions Bernal as a fiercely protective aide who was dubbed the leader of the ‘loyalty police’ by other former Biden staffers.

His LinkedIn page lists him as currently working as Jill Biden’s chief of staff in the Transition Office of Former President Joe Biden.

Bernal was originally slated to appear last month for a voluntary transcribed interview, but he and his lawyers backtracked after the Trump administration announced it was waiving executive privilege rights for him and several other former White House staffers.

If he appears, he will be the fourth ex-Biden aide to sit down with House GOP investigators.

Longtime Biden advisor Ashley Williams appeared for a nearly six-hour transcribed interview on Friday, following a brief sit-down by former Biden physician Kevin O’Connor.

O’Connor, like Bernal, appeared under subpoena. His closed-door deposition lasted less than 30 minutes, with the doctor invoking the Fifth Amendment on all questions outside his name.

O’Connor’s lawyers said he did so out of concern for doctor-patient confidentiality. Comer, however, accused him of covering for the octogenarian former president. 

This post appeared first on FOX NEWS

After a relatively quiet week for the S&P 500, we’re seeing some interesting shifts in sector dynamics. Let’s dive into the latest rankings, RRG analysis, and what it means for our portfolio strategy.

Sector Shifts and RRG Insights: Materials on the Move

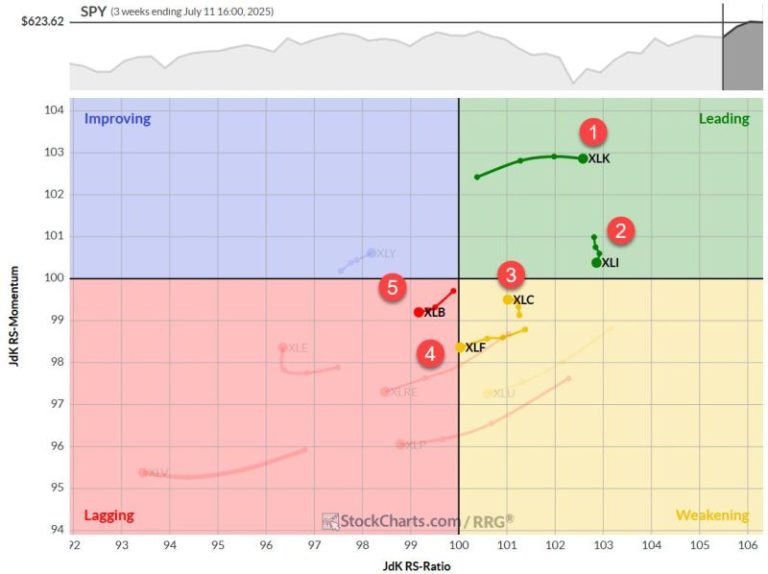
The big news this week is the ascent of the Materials sector, which has muscled its way into the top five at the expense of the Utilities sector.

The rest of the top five remained steady, but we’re seeing some movement in the lower ranks as well. Consumer Discretionary made a notable jump from #9 to #7, pushing Consumer Staples and Real Estate down a notch each. Energy and Health Care continue to bring up the rear at #10 and #11, respectively.

  1. (1) Technology – (XLK)
  2. (2) Industrials – (XLI)
  3. (3) Communication Services – (XLC)
  4. (4) Financials – (XLF)
  5. (6) Materials – (XLB)*
  6. (5) Utilities – (XLU)*
  7. (9) Consumer Discretionary – (XLY)*
  8. (7) Consumer Staples – (XLP)*
  9. (8) Real-Estate – (XLRE)*
  10. (10) Energy – (XLE)
  11. (11) Healthcare – (XLV)

Weekly RRG

The weekly Relative Rotation Graph (RRG) gives us a broader perspective on sector trends. Technology continues to dominate, firmly entrenched in the leading quadrant, no surprises there. Industrials is showing stability with a short tail in the leading quadrant, indicating a consistent relative uptrend.

Communication Services, however, is raising some eyebrows. It’s lurking in the weakening quadrant with a short tail, suggesting a stable relative uptrend but with negative momentum. Financials are teetering on the edge of the lagging quadrant, a move that demands attention. Materials, despite its rise in the rankings, is actually in the lagging quadrant on the weekly RRG. You will see why it made its way into the top 5 on the daily RRG.

Daily RRG

On the daily RRG, we get a more nuanced picture of short-term sector movements:

  • Materials (XLB) is the star of the show, crossing into the leading quadrant and standing alone in that coveted space.
  • Financials (XLF) is showing weakness, rolling over and heading back towards the lagging quadrant — confirming what we saw on the weekly chart.
  • Communication Services is on the verge of crossing into the lagging quadrant, a sign that is not great for its current #3 ranking.
  • Industrials is flexing its muscles, approaching the leading quadrant with a positive heading.
  • Technology, while rotating into the weakening quadrant, still has ample room to bounce back into leading territory.

Technology

The tech train continues to roll, breaking through resistance around 240 and maintaining its upward trajectory in both price and relative strength. The RS line is pushing higher after a clean breakout from its falling trend, a bullish sign for the sector leader.

Industrials

XLI is following through nicely on both price and relative strength charts. The raw RS line has established a new higher low, dragging the RS ratio higher. In my opinion, this sector looks rock-solid.

Communication Services

Here’s where things get dicey. XLC is clinging to its breakout above 105, but last week’s decline is testing that former resistance as new support. The raw RS line breaking below rising support is a warning sign that this sector could be in for a bumpy ride.

Financials

Similar to Communications Services, Financials has retreated to test old resistance as support. The raw RS line looks even worse here, having broken out of its rising channel weeks ago. Both RRG lines are flirting with the 100 level; a further push into the lagging quadrant seems likely.

Materials

XLB is showing some muscle, breaking out of its falling channel and taking out recent highs. The raw RS line is pushing against falling resistance — if it can break through, we could see a significant turnaround in the RRG lines, confirming the sector’s newfound strength.

Portfolio Performance

Now, for the part that might sting a bit, the portfolio drawdown is ongoing. It’s something trend followers need to learn to live with. Currently, the portfolio is down about 2% for the year, while the S&P 500 is up over 6%. That puts us roughly 8% behind the benchmark YTD.

It’s not a comfortable position, but it’s part of the game. Trend-following strategies often lag in choppy or rapidly changing markets. The key is to stay disciplined and trust in the long-term efficacy of our approach.

#StayAlert and have a great week, Julius


Bitcoin ($BTCUSD) is riding a wave of surging optimism, smashing past $112k as retail and institutional capital pour into the cryptocurrency. Some say the market has grown euphoric, and that a sharp pullback may be lurking around the corner. Others believe this is just the beginning of another leg higher.

A few key questions to guide your analysis: What does $BTCUSD’s history tell us about breakouts above major resistance after a prolonged period of sideways movement? If it’s the start of another move higher, how can you project an upside target? And, if it reverses, where could support levels come into play?

What $BTCUSD’s History Reveals About Breakouts and Big Rallies

Let’s begin by taking a look at a 3-year weekly chart.

FIGURE 1. WEEKLY CHART OF $BTCUSD. Note the crypto’s impressive rallies after clearing resistance following a prolonged period of sideways trading.

In 2023, $BTCUSD traded sideways for six months, repeatedly failing to break above resistance around $31k. But once it did, the crypto soared more than 126% before a major pullback.

A similar pattern unfolded in 2024: seven months in a wide range, unable to clear resistance between $71k and $73k. When $BTCUSD finally broke out in November, it staged a parabolic move, rallying nearly 47% before pulling back again, setting another key resistance zone that brings it to overhead resistance range between $110k–$112k.

So this answers the question posed about $BTCUSD’s historical tendencies after breaking above a prolonged range. Historically, the crypto tends to stage an outsized run once it clears critical resistance. But will it happen this time around? If so, how can you estimate a potential upside target? And if the breakout fails, where might $BTCUSD find support?

Seasonality Trends: $BTCUSD’s Strongest Months

Before looking at a daily chart, let’s look at $BTCUSD’s seasonality chart going back 10 years. If you’re curious as to how the crypto has performed during the summer months, maybe this can help.

FIGURE 2. 10-YEAR SEASONALITY CHART OF $BTCUSD. Most months on average have been quite strong for the asset, but October’s performance has been strong, with an average seasonal return of 21%.

According to its seasonality performance, July is arguably strong with a favorable positive close rate (70%) and return (9.6%). However, October is the crypto’s strongest month, with an 89% positive close rate and an average return of 21%. Over the last 10 years, $BTCUSD’s performance has been volatile, which accounts for the outsize returns on this chart. While seasonal tendencies don’t guarantee a repeat, knowing the general bullish/bearish seasonality context can help inform your analysis and trading decisions.

Now, let’s look at a daily chart to find entry points or estimate an upside target while identifying support, should its breakout fail to follow through.

$BTCUSD Breaks Critical $112K Resistance

FIGURE 3. DAILY CHART OF $BTCUSD. The asset just broke above critical resistance. If you have a position, now’s the time to estimate potential price targets.

$BTCUSD just broke the critical resistance level of $112k. The Relative Strength Index (RSI) is indicating strong momentum, easing into an overbought reading. While there’s no way to fundamentally determine the crypto’s upside target, one technical method is to use a measured move by taking the height of the prior range and adding it to the top of the range (or the breakout level; this varies by trader).

Calculating an Upside Target Using a Measured Move Approach

Measuring the range from the support area around $98k up to $110–112k (we’ll settle for $110k), you can project that distance of $12k above the top level of the breakout range, which implies a potential target near $124k, more or less.

$110k breakout + $12k range height = $122k–$124k target, depending on entry.

However, note that some traders don’t wait for a 100% measured move before taking profits. Some will exit positions as soon as a 60% move has occurred, but that really depends on the trader.

Key Support Levels to Watch if the Breakout Fails

Now, if $BTCUSD fails to follow through and reverses, you can reasonably expect support at roughly these three levels:

  • The breakout level near $112k.
  • A strong historical support level at around $110k.
  • Another support level within the previous trading range (shaded red) near $100k, which coincides with concentrated levels of trading activity, according to the Volume-by-Price (the horizontal volume bars on the left side of the chart).

If $BTCUSD falls below the previous trading range, that is, below $98k, then the current rally is likely over.

What to Do Now

Ideally, a trader’s entry point would have been at $112k. Considering that some platforms allow fractional lots of $BTCUSD, some people may choose to enter smaller positions, as a fractional position would minimize risk and reward.

If you already have a position in $BTCUSD, put it in your ChartLists, and set a price alert at $124k or any measured move percentage below that 100% target level (like 60% of the measured move would be at $119k).

If the breakout fails, expect a near-term bounce between $110k and $112k. However, a move lower toward $100k or $98k would likely signal an end to the bullish thesis. Traders might even consider placing a stop a few points below $98k to avoid the likelihood of further downside.

At the Close

$BTCUSD has a history of explosive moves after clearing major resistance, but it can just as easily blindside you with a sudden reversal. That’s why it’s crucial to keep upside and downside levels in mind. Seasonality also favors the bulls, with most months delivering favorable returns. Add the crypto to your ChartLists and set price alerts to track whether your upside target is hit, or whether downside levels signal either an early bounce or a failed rally.


Disclaimer: This blog is for educational purposes only and should not be construed as financial advice. The ideas and strategies should never be used without first assessing your own personal and financial situation, or without consulting a financial professional.

Join Dave as he reviews three common candle patterns traders can use to identify potential turning points. From bullish engulfing patterns to evening star patterns, Dave gives insights on how to leverage these powerful candle signals to anticipate market shifts. He also shows combining candle patterns with conventional technical analysis tools can help improve success rates.

This video originally premiered on July 14, 2025. Watch on StockCharts’ dedicated David Keller page!

Previously recorded videos from Dave are available at this link.

Mani Alkhafaji, vice president of corporate of development and investor relations at First Majestic Silver (TSX:AG,NYSE:AG) discusses silver’s recent price rise.

He notes that the gold-silver mining ratio is at seven to one, while the price ratio is at 90 to one.

‘That tells us silver needs to play catch up to collapse that ratio,’ he said.

Securities Disclosure: I, Charlotte McLeod, hold no direct investment interest in any company mentioned in this article.

This post appeared first on investingnews.com

Has silver’s moment finally arrived?

Precious metals analyst Ted Butler believes the answer is ‘yes.’

‘I think this is the moment, because we broke through technically what was a really important level — that US$35, US$36 (per ounce) level,’ he said. He sees a clear path for silver to outperform gold.

Securities Disclosure: I, Charlotte McLeod, hold no direct investment interest in any company mentioned in this article.

This post appeared first on investingnews.com
Adrian Day, president of Adrian Day Asset Management, shares his latest thoughts on gold.

He also discusses the opportunity in gold stocks, saying that while as a group they’re up 55 percent in last year, valuation metrics are lower than they were two years ago.

Securities Disclosure: I, Charlotte McLeod, hold no direct investment interest in any company mentioned in this article.

This post appeared first on investingnews.com

After soaring to all-time highs during the first quarter of 2025, how could gold follow up during Q2?

By setting new price records, of course.

Tariff threats, financial uncertainty and geopolitical tensions all fueled the yellow metal’s price rise during the second quarter of the year, which saw gold reach the US$3,500 per ounce mark for the first time.

While central banks continued to make gold purchases during the period, so too did retail investors, who shied away from US treasuries in favor of a more tangible safe-haven asset class.

What happened to the gold price in Q2?

Gold had an impressive run during the first quarter of the year, steadily rising from US$2,658.04 on January 2 to US$3,138.24 on April 2, leaving investors to wonder how much more gas was available for Q2.

Gold price, April 1 to July 10, 2025.

Chart via Trading Economics.

The price of gold started the second quarter on a downswing, falling below the US$3,000 mark by April 8, but quickly found momentum and soared to its quarterly high of US$3,434.40 on April 21.

It broke through the US$3,500 threshold briefly during the day’s trading session.

However, the gains were temporary, and gold once again fell; by May 1, it had dropped to US$3,237.30.

The metal saw a slight rebound to US$3,400.70 before the May meeting of the US Federal Reserve, but it came under pressure after that and had fallen to US$3,185 by May 14.

The end of May saw more tailwinds for the gold price, pushing it first to US$3,358 by May 23, then to US$3,381.70 by June 2. By the middle of the month, it was back to trading above US$3,400. Since that time, the precious metal has remained mainly above the US$3,300 level, closing the quarter at US$3,303.30 on June 30.

Tariff uncertainty helps boost gold price

The biggest story from the first quarter has carried over into the second quarter: tariffs.

Since the start of his second term in the Oval Office, US President Donald Trump has applied the threat of tariffs like a cudgel in trade talks with other countries. His long-held belief is that other nations, even longtime allies, are benefiting from trade with the US, while the US itself is facing detrimental effects.

During the first quarter of the year, the Trump administration levied tariff threats against Canada and Mexico. While most of his promised import fees were dialed back at the eleventh hour, a 25 percent tax was still applied to imports of Canadian steel and aluminum, as well as non-CUSMA-compliant automobiles and parts.

On April 2, Trump announced a broader set of tariffs on nearly every country in the world, regardless of trade status with the US. Dubbed “Liberation Day” by Trump, the executive order applied a baseline 10 percent fee to all imports from most countries to the US, plus significant reciprocal measures against countries with the largest trade deficits.

The new measures, set to be implemented on April 9, created panic among investors, causing a global market meltdown. Fear also spread to US debt holders, such as Japan and Canada, which began to sell US treasuries, pushing up the 10 year bond yield. Spooked investors rapidly flocked to gold, pushing the price to record highs above US$3,400.

“The bond market understands that Washington is so broken and the debt situation is so bad,’ he explained. ‘It varies in degrees compared to other countries, but everybody’s in the same boat. That’s why gold all of a sudden … gold is the safe haven now, even more than treasuries. And I don’t think a lot of people every thought they’d see that again.’

Ultimately, the stock market turmoil and the shift in bond market sentiment brought about a quick reversal from Trump, who paused his tariff plans for 90 days. Although the gold price showed signs of easing as market participants calmed, the metal remained high through the end of the quarter as uncertainty remained near the surface.

The pause was set to expire on July 9, but the White House announced a last-minute extension delaying the implementation of the tariffs on all but 14 countries, including Japan, South Korea and South Africa.

However, there are still underlying concerns.

The US-China trade war, which raged through much of the first half of the year, was put on hold on May 12 after tariffs between the two largest economies reached their peak, adding headwinds to the gold price. Up to that point, the US had levied a 145 percent import tax on Chinese goods while China had applied a 125 percent tax on US imports.

Although tensions have stabilized since the pause, on July 7, China warned the US against reigniting conflicts. China also said it would retaliate against any country that makes deals with the US to China’s detriment.

Geopolitical tensions erupt in the Middle East

Financial uncertainty was a key driver of the gold price through the second quarter as investors sought to diversify their portfolios amid a chaotic investment landscape, but it wasn’t the only factor.

Geopolitical tensions also played a significant role, particularly in the Middle East.

With the Israel-Gaza conflict now past 18 months, the larger fear was that it would spill into a broader regional war.

Those fears were stoked in late May, when there was speculation that Israel was preparing to attack nuclear facilities in Iran. The news helped pull gold out of monthly lows as more investors sought the safety of the metal.

Ultimately, the speculation was true — on June 12, Israel launched attacks against key nuclear sites in Iran, causing Iran to launch counterattacks against targets in Israel and providing further tailwinds for the gold price.

What’s driving demand for gold?

Other support for the gold price came from continued purchases from central banks.

According to World Gold Council data, central banks bought 244 metric tons of gold in Q1. The amount was 24 percent higher than the five year quarterly average, but 9 percent lower than the average from the last three years.

The largest first quarter gold buyers were the National Bank of Poland, which added 49 metric tons of the metal to its holdings, increasing its total to 497 metric tons. This was followed by the People’s Bank of China, which purchased 13 metric tons, bringing its reported gold reserves to 2,292 metric tons

In another report, the World Gold Council indicates that despite high prices, central banks continued to buy gold in May, albeit at a slightly reduced pace, with a net 20 metric tons entering their reserves.

But it’s not just central banks that are picking up gold.

“In the past, there has been relatively little involvement, even to now, from western retail investors in this move. This has been overwhelmingly led by central banks and large funds,” Temple said.

However, he noted a shift in buying on the back of wider interest, pointing to gold’s popularity at Costco Wholesale (NASDAQ:COST), although he noted, ‘So far, this hasn’t moved the needle significantly.’

Temple added, “Traditionally the big needle mover when you’ve got these larger swings in markets and market sentiment has come from investors who are buying exchange-traded funds (ETFs) and buying the larger gold stocks, and then ultimately working their way down the food chain and buying the better exploration stories. We finally started in recent months to see some of that where it’s deserved. There have been some really nice moves.’

This idea is echoed in the World Gold Council’s June ETF report, which indicates that ETF flows ended the first half of 2025 with the highest semiannual inflows since the first half of 2020.

The North American movement led the way, with more than US$4.8 billion entering the market in June, bringing the total for the first half of the year to US$21 billion. This was followed by US$2 billion in inflows in Europe, with its first half total reaching US$6 billion. Asian markets added US$610 million with a first-half record of US$11 billion.

Gold price forecast for 2025

The expectation is that the factors that drove the gold price in H1 are unlikely to go away soon.

Trump continues to kick the tariff question down the road. And although a ceasefire has been called between Israel and Iran, tensions in the region are still high. The conflict between Russia and Ukraine is ongoing, with Russia escalating attacks at the start of July, to the point of invoking Trump’s ire.

“We were thinking that by the time you got into June, July, August, not only would you have some seasonal weakness, but you’d also have a situation where financial markets might have calmed down and taken a less pessimistic outlook to the economy, simply because the initial shock of Trump policies was in there and had been digested. What we’re seeing is a prolongation of that shock period.’

Financial uncertainty and conflicts were a theme echoed by Kandoshko.

She pointed to the July 9 — now August 1 — deadline for tariffs as a potential inflection point.

“This could spark another rally in gold prices if trade tensions escalate. I have a feeling that the existing tariffs will gradually push prices up, which might lead the Fed to hold off on cutting rates. In the grand scheme of things, higher inflation is likely to boost gold demand, especially from central banks,” Kandoshko said.

She also believes a weak US dollar will likely be a boon for gold, making it more attractive to overseas buyers.

Securities Disclosure: I, Dean Belder, hold no direct investment interest in any company mentioned in this article.

This post appeared first on investingnews.com